


A third-party risk management dashboard is fundamental for understanding the risk environment within an organization and making informed decisions. When presenting to the board, you probably want to show high level KPIs and insights, and explain the overall health of the program. In this blog, we go through 5 key indicators you should monitor in your dashboard.
Let’s go through each one of them with more detail.
Top 5 indicators of a Third-Party Risk Management Dashboard
- Third-party population broken down by security score and impact
- Riskiest third-parties
- Heat map – visualization of how risk looks across third-parties
- Areas of improvement – where and how to take action
- Benchmarking – historical analysis of your third-party risk management program
Let’s go through each one of them with more detail.
1. Third-party population broken down by security score and impact
Your starting point will probably be learning how many third-parties you have, and how many you need to prioritize versus those you just want to track. You’ll need to break down your third-party population in quantifiable segments — most likely, by trust score and by impact.
It’s up to you and your business needs to determine what constitutes “high” or “low” risk in each case (it even varies between industries). You’ll set the parameters and let your system do the rest.
Once you have these two indicators (score and impact), your tool should allow you to combine them to calculate the risk score. That would answer the following question: Where in your risk universe do your third-parties reside?
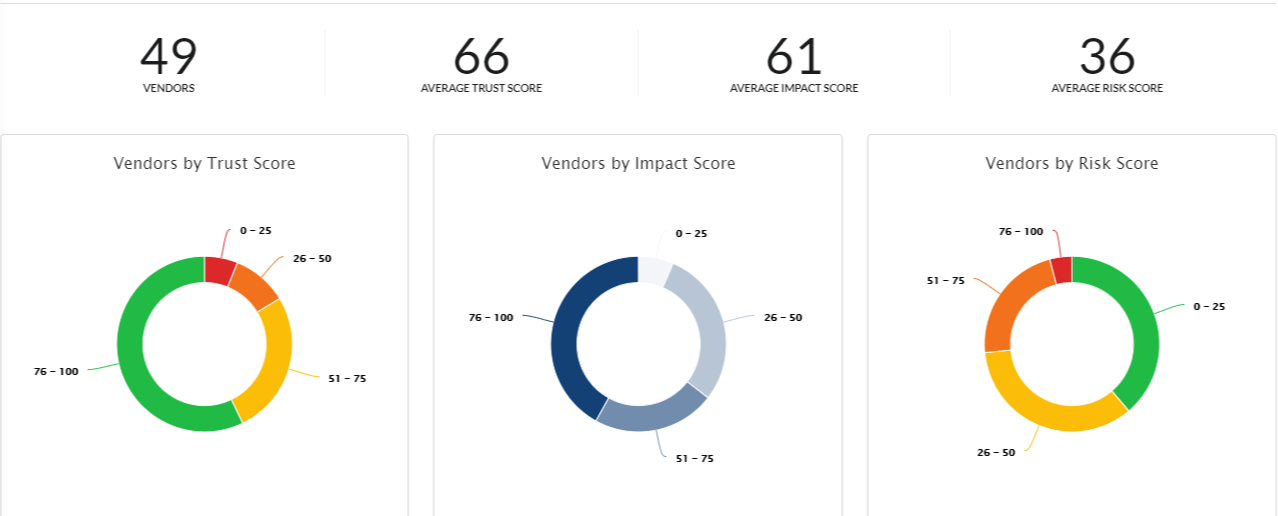
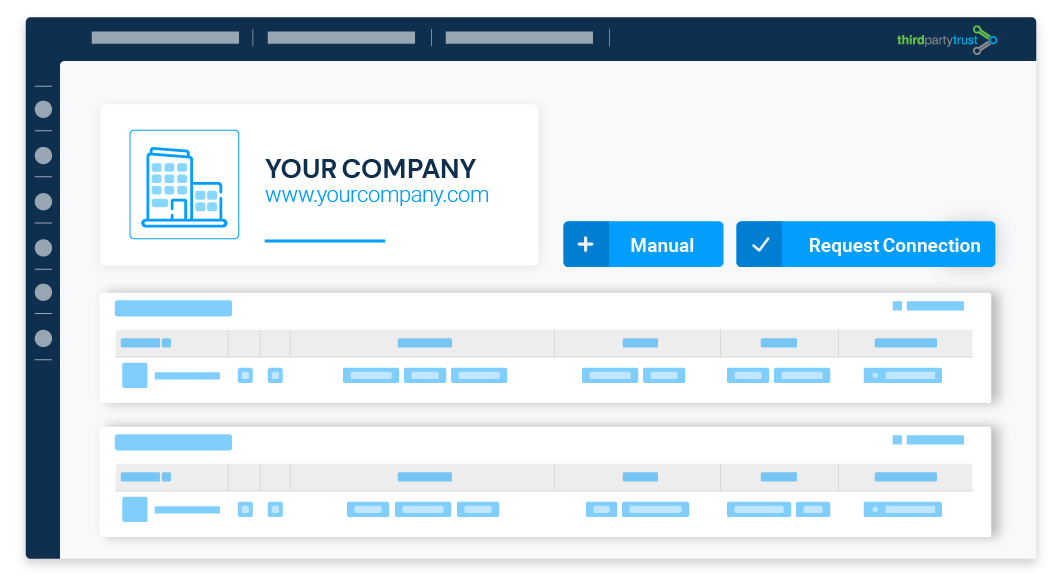
Third-party risk information at a glance within the ThirdPartyTrust dashboard
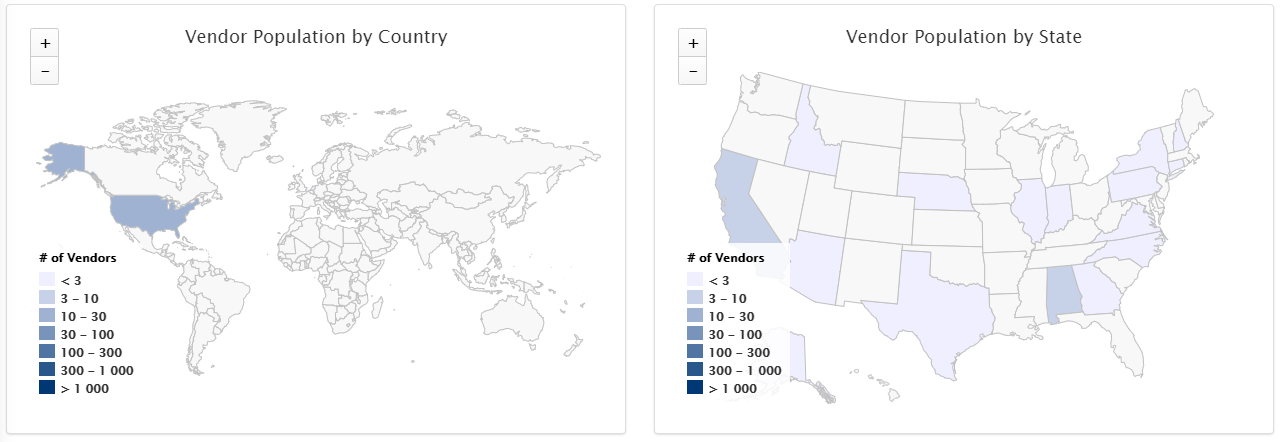
Geographical distribution of third-parties within the ThirdPartyTrust platform
2. Riskiest third-parties
Your dashboard should automatically provide analysis of the above indicators — for example, low trust score combined with high impact equals high risk.
Imagine how hard it would be to do this without a dedicated tool. You’d have to gather and contrast data manually, and face the challenge of comparing data points that are hard to compare without a standardized scoring system. So a powerful third-party risk management dashboard should definitely show your riskiest third-parties.
Also, it’s important to understand where your third-parties deliver service from, with insights on geographical concentration. You might, for example, have third-parties in countries with political issues, economic crisis, or a tendency for natural disasters. So having this information will be helpful to detect concentrations that might not be beneficial to the business and remediate the risks associated with them.
3. Heat map — visualization of how risk looks across third-parties
If you want to show the board what your supply chain risk looks like, you could really use a heat map of impact score vs. trust score. In our example, the horizontal axis shows impact, with the highest to the right. The vertical axis shows trust score, with the best security scores to the top.This follows the widely known risk equation:
Risk = Likelihood x Impact
When you start to combine these indicators is when you start getting valuable insights for improving your strategy. You can visualize how risk looks across all your third-parties, and take immediate action with the ones on the bottom right side of the matrix.
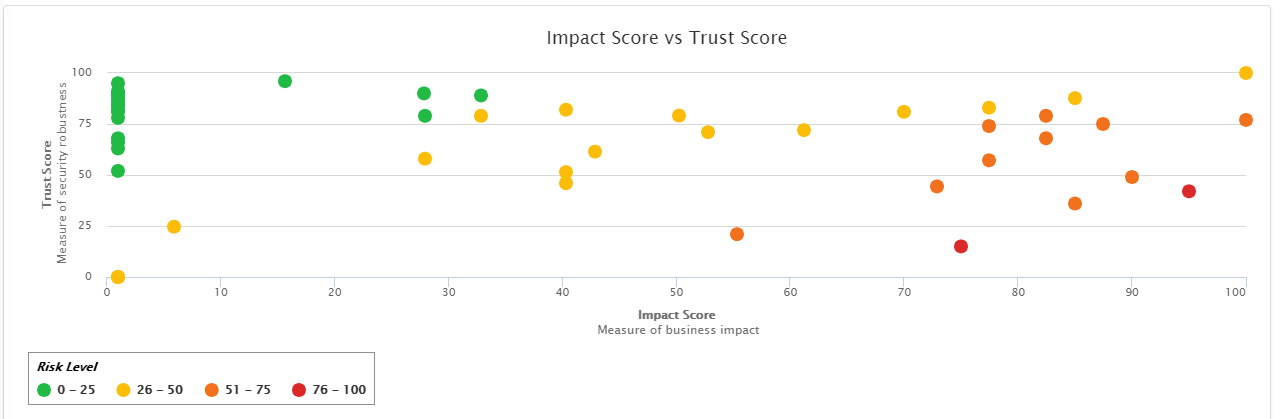
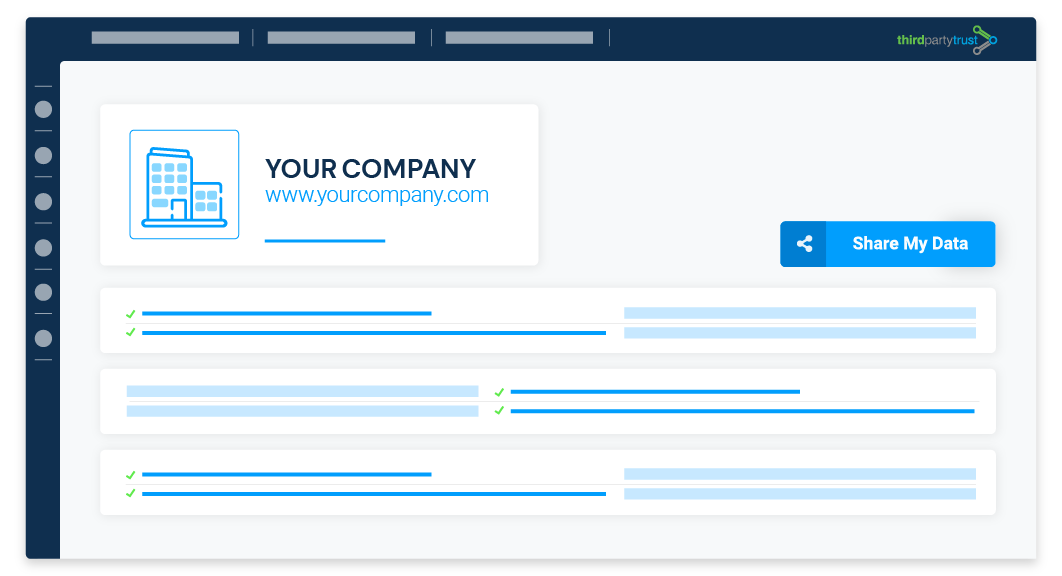
ThirdPartyTrust allows enterprises to focus on analyzing data instead of collecting it
4. Areas of improvement — where and how to take action
With all the data above, you can decide what to do in each case. Perhaps you decide to focus on improving trust score, and figure out ways in which a third-party can remediate issues. Or, you decide to reduce their impact in your business, by giving them access to less data.
At this point, you’re looking to use all the insights to bring down overall risk and make evidence-based decisions for your program.
5. Benchmarking – historical analysis of your third-party risk management program
Having measured, reported, and discussed your ups and downs, you can start analyzing the historical evolution of your risk indicators and your overall third party risk management program.
Being able to look historically at your program allows you to detect trends and patterns. You might, for example, realize that there’s a peak of activity on certain months every year, and you could consequently plan ahead.
The data you need, at your fingertips
With hundreds of third party vendors in your environment and limited human resources, you have to focus your attention on the highest risks. And the only way to identify the highest risks is with centralized, aggregated indicators.
Without quantifying your program, it’s hard to make the right call. If you’re managing things from a spreadsheet, you have no way to accurately quantify trust and impact, and therefore you can’t compare one third-party to another. And you certainly can’t factually tell your Manager “These are the top 5 risks our company has.”
ThirdPartyTrust has two solutions ready to help you quantify your program:
TPRM For Enterprises
Your one pane of glass risk dashboard: An end-to-end document repository and workflow automation tool to scale your vendor risk management program. Leverage a network of 15,000+ existing vendor profiles to fast forward your reviews and stay proactive with continuous monitoring.
Beacon for Third Party Vendors
Beacon is the single source of truth for vendors: A centralized security profile comprising all your questionnaires, certifications, and attestations, such as SIG Lite and Core, CAIQ, NIST, pentests, etc. Answer them once and easily share the latest versions any time your team receives a security assessment request.
Let us show you how to build your TPRM dashboard with ThirdPartyTrust. Request a demo.
Not sure where to start with TPRM?
Deciding if you need a third-party risk management tool and choosing the right one can be challenging. This buyer’s guide will put you on a path to auditable risk management and accelerate your journey to TPRM maturity.
You will learn how to boost efficiency, transparency, and control over your risk management process and business bottom line.
Sabrina Pagnotta
Sr. Content Strategist